
There is a question worth asking before the next platform investment: is your organization data-driven, or is it data-rich?
The two look identical on a slide. Both have a warehouse, a BI tool, a dashboard estate, and a leadership team that says decisions are based on evidence. The difference shows up in the meeting where the numbers disagree with someone's instinct. In a data-driven organization, that meeting is about the numbers. In a data-rich one, the numbers get set aside and the decision is made the way it would have been made anyway.
That gap is rarely a technology gap. It is almost always a data literacy gap — and it is the reason well-designed governance programs get experienced as bureaucracy.
What data literacy actually is
Data literacy is the ability to read, work with, analyze, and argue with data. In practice it is four distinguishable skills, and organizations tend to have some and not others.
Interpretation — reading a chart correctly, understanding what a percentage is a percentage of, noticing when a trend is within normal variation, knowing that a metric which moved 3% may not have moved at all.
Questioning — asking where a number came from, what population it covers, what it excludes, and whether it answers the question actually being asked. This is the skill that most reliably distinguishes a data-literate organization, and the one least often taught.
Application — translating an insight into a decision, including deciding that the evidence is too weak to act on. Analysis that never changes anything is a cost center.
Communication — explaining a finding to someone who will not read the appendix, without either overclaiming or hedging it into meaninglessness.
Notice that none of these are tool skills. Someone can be fluent in SQL and illiterate in the sense that matters, and a competent operations manager with no technical training can be highly literate.
The symptoms of low literacy
You do not need a survey to spot this. The patterns are consistent, and each one has a direct consequence for governance.
| Symptom | What it looks like | Effect on governance |
|---|---|---|
| Metric misreading | A KPI moves within noise and triggers a reorganization | Governance gets blamed for "bad data" that was fine |
| Low trust in reporting | Teams maintain private spreadsheets alongside official reports | Shadow data multiplies faster than it can be governed |
| Intuition override | Evidence presented, acknowledged, and then ignored | Investment in quality has no visible payoff, so it stops |
| Definitional drift | Every team has its own version of the same metric | The business glossary is written and never consulted |
| Question avoidance | Nobody asks where a number came from | Errors survive for quarters because no one probes |
The last one is the most expensive and the hardest to see, because it looks like consensus.
Why literacy determines whether governance is welcomed
This is the part that gets missed, so it is worth stating directly: governance controls are experienced as bureaucracy in exact proportion to how little the person subject to them understands why they exist.
Consider a steward asking a team to use the approved definition of "active customer" rather than their own. To someone who understands that the board pack, the churn model, and the commercial forecast all consume that number, the request is obviously reasonable. To someone who does not, it is a data person telling them their number is wrong when their number has always worked fine for their purpose.
The same asymmetry applies to every control. Classification looks like paperwork if you have not thought about what a leak would cost. Quality thresholds look arbitrary if you do not know which downstream models break. Access approval looks like gatekeeping if you have never seen an unauditable copy of customer data on a laptop.
Governance can be designed well and still be resented, and the resentment is a literacy problem wearing a governance costume. This is why the programs that succeed spend part of their effort on explanation rather than enforcement — not communications campaigns, but making the reasoning visible at the moment the control applies.
There is a practical version of this. When a steward asks for a change, the request should carry its reason and its consequence: "the forecast and the churn model both read this field, and last quarter the mismatch cost us two days of reconciliation in the close." That sentence takes ten seconds to add and converts an instruction into an argument. Most governance friction I have been called in to fix was a missing sentence of that kind, repeated a few hundred times.
What high-literacy organizations do differently
Four patterns show up repeatedly in organizations where this works, and none of them is a training course.
Definitions are shared and enforced at the source. There is one calculation for each significant metric, it lives in the semantic layer rather than in each analyst's query, and using it is easier than rebuilding it. Literacy is much cheaper when the environment does not require people to be skeptical about everything.
Stewardship is distributed into the business. The person who answers "what does this field mean" sits in the domain rather than in a central team. That both scales the answer and raises literacy in the surrounding team, because the explanation happens in context.
Analysis is published with its reasoning. Not just the chart — the population, the exclusions, the confidence, and what would change the conclusion. Teams learn to question data by seeing what a good question looks like.
Learning is continuous and role-specific. A finance business partner and a warehouse supervisor need different literacy. Generic dashboard training for everyone is the cheapest possible intervention and produces roughly nothing.
Assessing where you stand
If you want to be systematic about it, the analytics maturity models give you a vocabulary. The TDWI model describes five stages that most organizations recognize immediately:
Nascent — data use is ad hoc and individual. Reporting is manual, and its accuracy depends on who produced it.
Emerging — leadership is asking for evidence. Some training exists. Definitions are inconsistent and everyone knows it.
Developing — literacy programs are formalized, data is consulted routinely in operational decisions, and a data culture is starting to be visible in how meetings run.
Mature — fluency extends well beyond technical teams. Standardized definitions are the default, and cross-functional analysis does not require translation.
Leading — literacy is part of the organization's identity. Evidence is expected, questioning is normal, and analytical capability is a competitive input rather than a support function.
Complementary frameworks are worth knowing if you need a specific lens: the Gartner data literacy work focuses on aligning capability with business strategy, DCAM evaluates end-to-end data capability including where literacy touches architecture and quality, and Qlik's assessment measures individual skill progression alongside organizational culture.
One caution about all of them. A stage label is a diagnostic, not an objective. "Move from Developing to Mature" is not a business outcome and will not survive a budget review. "Reduce the number of competing revenue definitions from four to one, and cut the reconciliation effort in the monthly close by two days" is the same progress expressed in a form someone will fund.
A cheaper way to baseline
Before commissioning a formal assessment, three measurements will tell you most of what you need.
Count the competing definitions of your five most-quoted metrics. If revenue has four calculations in active use, you have your answer.
Ask ten people in a business function to explain what one dashboard they use is actually measuring. The variance in the answers is your literacy score, and it is usually humbling.
Count the shadow spreadsheets maintained in parallel with official reporting. Every one of them represents someone who did not trust or did not understand the official source, and the total is a reasonable proxy for how much your literacy gap is costing. If you want that expressed in money, the cost of bad data calculator will convert the rework into an annual figure.
Closing the loop
Governance and literacy are not sequential — you do not finish one and start the other. They reinforce each other or they decay together.
Governance gives literacy something to be literate about: approved definitions, documented lineage, known quality levels, a catalog that answers questions. Literacy gives governance the constituency it needs: people who understand why a control exists comply with it without being chased, and people who question numbers find errors that no monitoring rule caught.
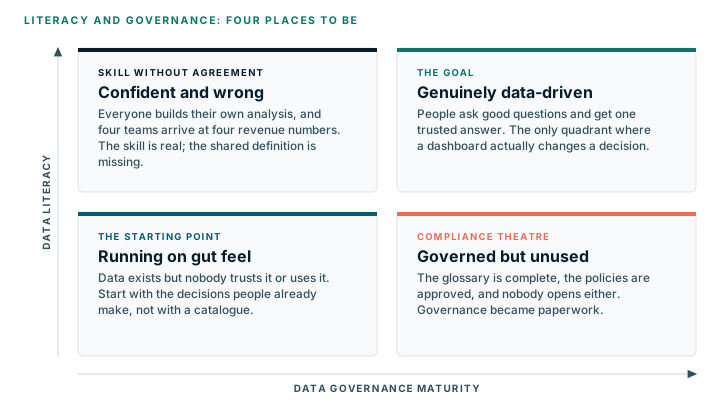
The organizations that get stuck are the ones that invest heavily in one and not the other. Governance without literacy produces well-documented data nobody uses confidently. Literacy without governance produces confident people reasoning from inconsistent numbers, which is arguably worse.
For the operational detail on building literacy as a capability rather than an event, Data Literacy Is a Business Capability covers the habits and support systems that make it stick. If you would rather start by finding out which side of this pair is weaker in your organization, the maturity assessment covers both.